Can we detect more ephemeral floods with higher density harmonized Landsat 8/Sentinel 2 data compared to just one sensor?
Abstract
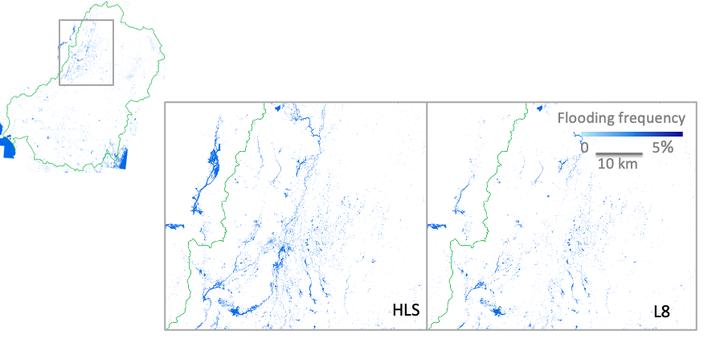
Floods, defined as water that temporarily submerges land for over 72 hours or longer, are the largest natural hazard in terms of life loss and economic damage. Effective and immediate disaster response management can reduce the impact of floods but it requires near real-time information on flood occurrence, typically derived based on Earth Observation data. Several water-mapping efforts at large scale have used optical data, despite the fact that cloud cover compromises image time series. This is because systematically acquired optical data providing global coverage have been available for over 40 years. Previous work based on optical data used either high temporal but lower spatial resolution data (e.g. daily MODIS) or lower temporal resolution but higher spatial resolution data (e.g. Landsat). Both data sources have limitations as they may miss small floods/flood edges in the case of MODIS or ephemeral floods in the case of Landsat. With the launch of NASA’s Landsat-8 (L8) and two Sentinel-2 (S2) satellites by the European Space Agency, it is now feasible to acquire optical observations once every 3-4 days. To assess whether the increased temporal frequency of multi-sensor data improves our ability to detect surface water and flooding extent compared to a single sensor, we focused on Australia’s Murray-Darling Basin (MDB), a dynamic dryland basin that experiences ephemeral floods. We used NASA’s Harmonized Landsat/Sentinel-2 (HLS, https://hls.gsfc.nasa.gov/) Surface Reflectance Product, a seamless data set combining L8 and S2 observations, as input to machine learning-based mapping of surface water and flooding. We chose 2019 as the most recent year of full image record of HLS data, with all three sensors operating at full capacity. We show that large short-lived flooding events were detected only by HLS (the combined dataset) but have been entirely missed by L8 (see figure). We found that the area of water (permanent and flooding) identified with HLS was overall greater than that identified by L8. The year 2019 was Australia’s driest years on record. In 2019 there were extremely low river flows, reduced or depleted urban water supplies with several smaller towns running out of regular water supplies entirely, few flood events and drying wetlands. Despite the sparse occurrence of floods in 2019 in the MDB, HLS has been able to detect floods in cases when one sensor (L8) alone was not. The dense optical time series offered by the HLS data set is thus critical for capturing dynamic phenomena, such as ephemeral floods in dryland systems. This work also highlights the importance of existing harmonized data products such as HLS.
Mirela G. Tulbure
Professor
I am a Professor with the Center for Geospatial Analytics at North Carolina State University (NCSU).
Mark Broich
Postdoctoral Research Fellow
Played a central research role on the Geospatial Analysis for Environmental Change team and had a key role in building the GAEC lab.
Vini Perin
PhD Student
My research interests include surface water, agriculture, irrigation, remote sensing and hydrological modeling.
Mollie D. Gaines
Postdoctoral Research Scholar
I am a Postdoctoral Research Scholar in the Department of Forestry and Environmental Resources at North Carolina State University.